The main highlight of this new IDC data release is in new analysis results collections, complementing the existing images with both expert- and AI-generated annotations. Although the total size in terabytes is modest, this release is a major milestone for IDC in both the variety of annotations and the volume of analysis results.
The annotations and analysis results we release have been generated by various groups, and presented in peer-reviewed publications. With this release, all of these become available in standard DICOM representation, viewable in IDC viewers, searchable, and linked to the original images using standard DICOM capabilities. We hope these new collections will support the development and comparison of new analysis tools, and will open new opportunities for secondary analyses of the annotated images.
To support these collections and new DICOM data types, we implemented numerous new features and bug fixes in IDC viewers - both the OHIF Viewer (support of planar annotations) and Slim (improved robustness of segmentation visualization, support of fractional segmentations and parametric maps, improved support of bulk annotations, new UI features). There are quite a few improvements we are still working on, but we believe the tools reached the point where they provide sufficient support for these collections.
We also updated the IDC Portal to improve usability, and added new features to support direct download from the browser at the collection, cohort and cart level (up to ~3TB in size – for larger subsets of data you will need to use command-line download client).
See full data release notes in https://learn.canceridc.dev/data/data-release-notes#v23-nov-2025.
Quick reference if you are new to IDC:
- Getting started with IDC Portal
- Quick instructions on using IDC viewers
- Getting started with programmatic access
Brief summary of the new analysis results collections follows!
BoneMarrow-PediatricLeukemia
This collection is updated and now includes expert annotations of selected cells with their location and type. Read more in the preprint linked from the collection details page.
- collection details: Höfener, H., Kock, F., Pontones, M. A., Ghete, T., Pfrang, D., Dickel, N., Kunz, M., Schacherer, D., Clunie, D. A., Fedorov, A., Westphal, M., & Metzler, M. (2025). BoneMarrowWSI-PediatricLeukemia: A Comprehensive Dataset of Bone Marrow Aspirate Smear Whole Slide Images with Expert Annotations and Clinical Data in Pediatric Leukemia [Data set]. Zenodo. https://doi.org/10.5281/zenodo.17486627
- open in IDC Portal: https://portal.imaging.datacommons.cancer.gov/explore/filters/?collection_id=Community&collection_id=bonemarrowwsi_pediatricleukemia
- sample case: https://viewer.imaging.datacommons.cancer.gov/slim/studies/1.2.826.0.1.3680043.8.498.24144283661646178704245748389871574522/series/1.2.826.0.1.3680043.8.498.8159440367804505500314614006287096679
TCGA-SBU-TIL-Maps
Tumor Infiltrating Lymphocyte annotations for a subset of TCGA slides generated using algorithms developed by Joel Saltz team at Stony Brook. Some of those were shared earlier in CSV format by TCIA.
- collection details: Bridge, C., Abousamra, S., Saltz, J., Gupta, R., Kurc, T., Zhang, Y., Zhao, T., Batiste, R., Samaras, D., Bremer, E., Shroyer, K. R., Nguyen, V., Singh, P., Hou, L., Arnam, J. V., Shmulevich, I., Rao, A. U. K., Lazar, A. J., Sharma, A., … Fedorov, A. (2025). TCGA-SBU-TIL-Maps: AI-derived Tumor Infiltrating Lymphocyte maps for the TCGA collections [Data set]. Zenodo. https://doi.org/10.5281/zenodo.16966286
- open in IDC Portal: https://portal.imaging.datacommons.cancer.gov/explore/filters/?analysis_results_id=TCGA-SBU-TIL-Maps
- example visualization: https://viewer.imaging.datacommons.cancer.gov/slim/studies/2.25.49355557987400344027775686673704794205/series/1.3.6.1.4.1.5962.99.1.3140643155.174517037.1639523215699.2.0

TCGA-GBM360
Aggressiveness maps described in this Nature Communications paper, generated using GBM360 software from the Gevaert Lab at Stanford for a subset of TCGA pathology slides.
- collection details: Bridge, C., Zheng, Y., Gevaert, O., Clunie, D. A., & Fedorov, A. (2025). TCGA-GBM360: GBM360 aggressiveness maps for a subset of TCGA pathology slides [Data set]. Zenodo. https://doi.org/10.5281/zenodo.17470191
- open in IDC Portal: https://portal.imaging.datacommons.cancer.gov/explore/filters/?analysis_results_id=TCGA-GBM360
- example visualization: https://viewer.imaging.datacommons.cancer.gov/slim/studies/2.25.103659964951665749659160840573802789777/series/1.3.6.1.4.1.5962.99.1.1131469279.179373488.1637514041823.2.0

NLST-Sybil
Expert annotations of the lung lesions in the NLST CT images converted from the JSON representation released earlier by the Regina Barzilay group at MIT, and described in this Journal of Clinical Oncology paper.
- collection details: Krishnaswamy, D., Clunie, D. A., & Fedorov, A. (2025). NLST-Sybil: Expert annotations of tumor regions in the NLST CT images [Data set]. Zenodo. https://doi.org/10.5281/zenodo.15643335
- open in IDC Portal: https://portal.imaging.datacommons.cancer.gov/explore/filters/?analysis_results_id=NLST-Sybil
- example visualization: https://viewer.imaging.datacommons.cancer.gov/v3/viewer/?StudyInstanceUIDs=1.2.840.113654.2.55.179174366077312471225650070175400666493

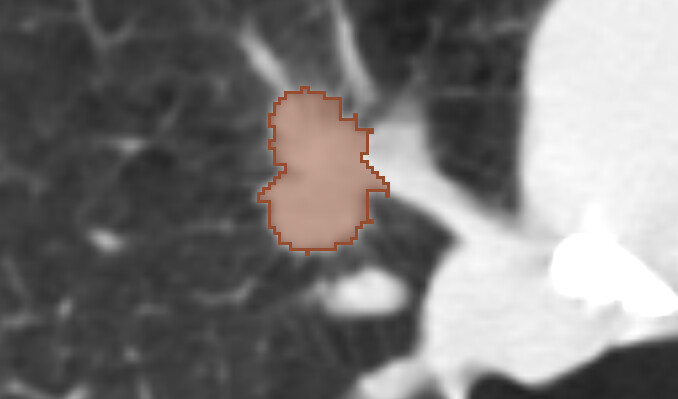
NLSTSeg
Volumetric segmentations of the lung lesions in the NLST CT images converted from NIfTI representation published earlier by Chen et al..
- collection details: Krishnaswamy, D., Clunie, D. A., & Fedorov, A. (2025). NLSTSeg: Expert lesion segmentations and radiomics features for NLST CT images [Data set]. Zenodo. https://doi.org/10.5281/zenodo.17362625
- open in IDC Portal: https://portal.imaging.datacommons.cancer.gov/explore/filters/?analysis_results_id=NLSTSeg
- example visualization: https://viewer.imaging.datacommons.cancer.gov/v3/viewer/?StudyInstanceUIDs=1.2.840.113654.2.55.82681520469274836520987761108780143488
Lung-PET-CT-Dx-Annotations
Annotations of the lung lesions in the Lung-PET-CT-Dx collection, originally shared in TCIA in the XML format.
- collection details: Krishnaswamy, D., Clunie, D. A., & Fedorov, A. (2025). Lung-PET-CT-Dx-Annotations: Expert annotation of lung tumors for the Lung-PET-CT-Dx collection [Data set]. Zenodo. https://doi.org/10.5281/zenodo.16989820
- open in IDC Portal: https://portal.imaging.datacommons.cancer.gov/explore/filters/?analysis_results_id=Lung-PET-CT-Dx-Annotations
- example visualization: https://viewer.imaging.datacommons.cancer.gov/v3/viewer/?StudyInstanceUIDs=1.3.6.1.4.1.14519.5.2.1.6655.2359.333670311640916222763343578453

ProstateX-Targets
Annotations of the cancer-suspected biopsy targets in the ProstateX MR images, along with the indication of clinical significance and Gleason grade for the sampled regions, originally shared in TCIA in the CSV format.
- collection details: Krishnaswamy, D., Clunie, D. A., & Fedorov, A. (2025). PROSTATEx-Targets: Point annotations of lesion targets for the PROSTATEx collection [Data set]. Zenodo. https://doi.org/10.5281/zenodo.15643313
- open in IDC Portal: https://portal.imaging.datacommons.cancer.gov/explore/filters/?analysis_results_id=ProstateX-Targets
- example visualization: https://viewer.imaging.datacommons.cancer.gov/v3/viewer/?StudyInstanceUIDs=1.3.6.1.4.1.14519.5.2.1.7311.5101.316302757120840825688456720609
(yes, we do have remaining work to improve text annotations rendered by the viewer, but for now at least you can easily see the locations of the targets!)
